Quick Summary About Me
Motivated and self-taught data analyst with a Bachelor's degree in Electrical Engineering and a robust set of skills in Python, MySQL, Tableau, Power BI, Excel, Git & GitHub, Salesforce Admin, VBA, AWS, web scraping, Snowflake & Pyspark.
Over the past year, I have dedicated myself to mastering these tools and technologies to transition into data analysis and business analysis roles.
With a strong passion for problem-solving and data-driven decision-making, I have worked on several projects that showcase my ability to gather, clean, analyze, and visualize data.
From building dynamic dashboards to automating data pipelines, my portfolio reflects my dedication to continuous learning and my drive to add value to any organization.


Developed a dynamic HR dashboard featuring high-level insights into employee demographics, retention, and salary trends.
Provided interactive visualizations for HR managers to assess active and terminated employee ratios, gender income gaps,
and the impact of education on compensation. Detailed employee records included for personalized analysis.
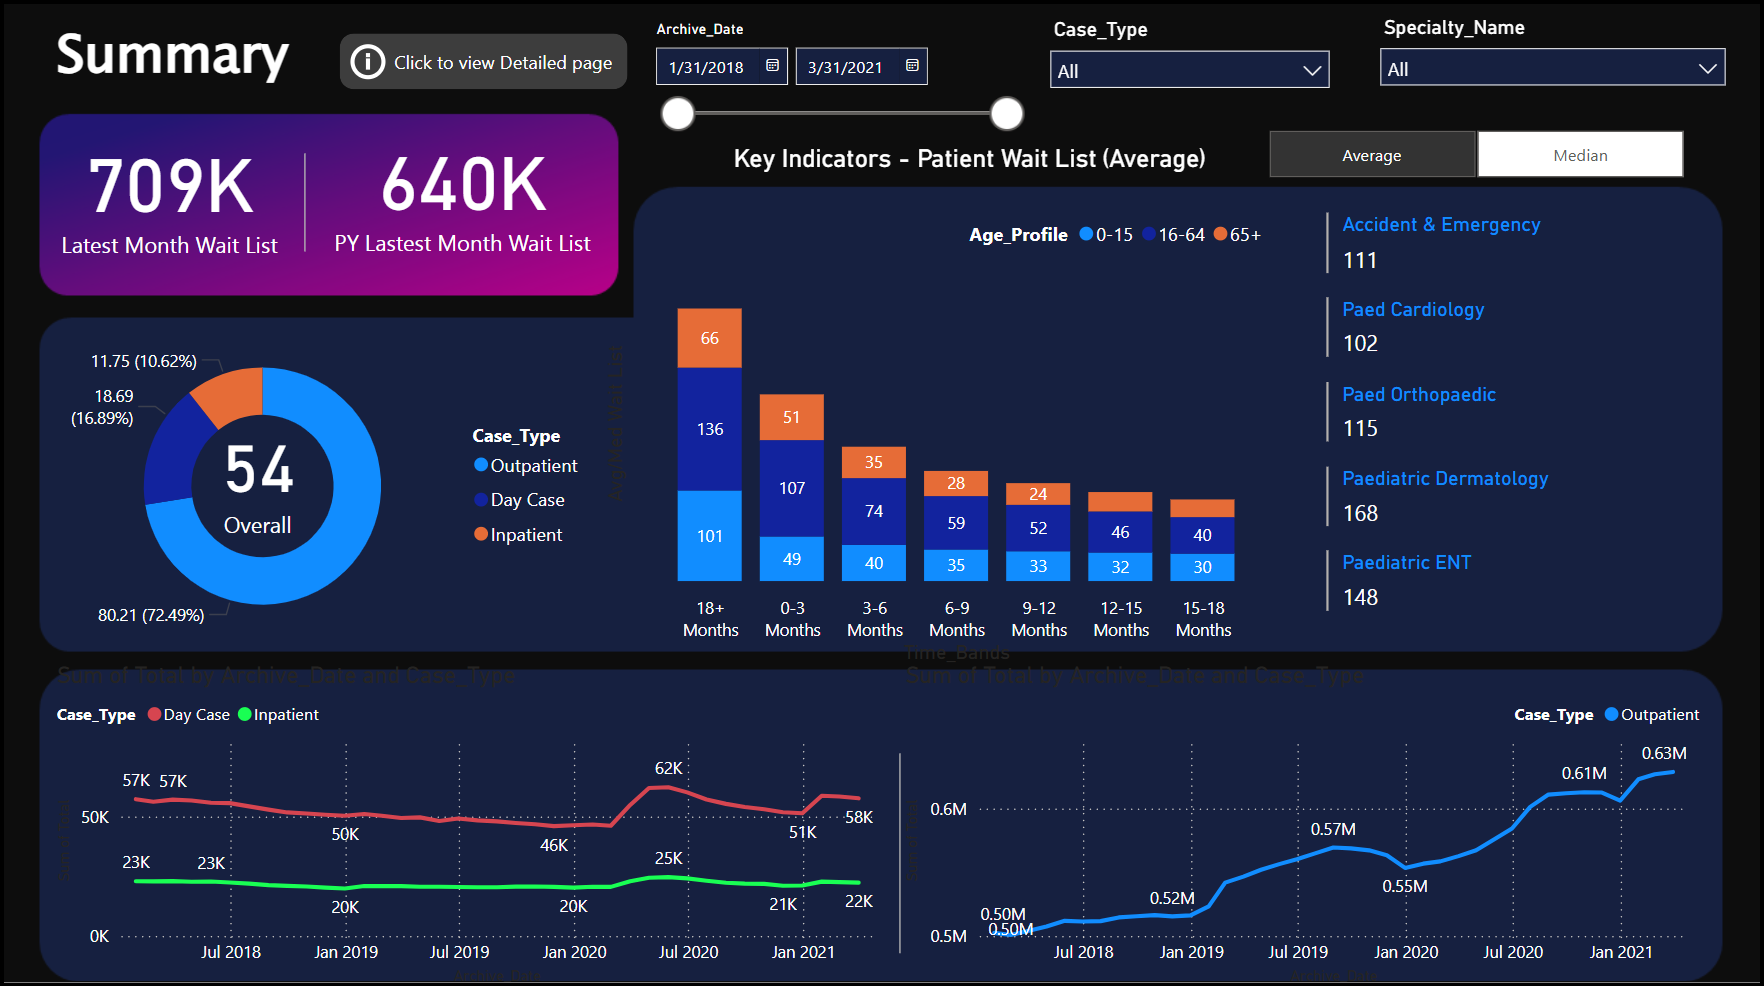
Designed a data-driven dashboard to provide healthcare administrators with real-time visibility into patient waitlists, categorized by case type, age, and time.
A detailed patient timeline view ensures easy access to key healthcare metrics.
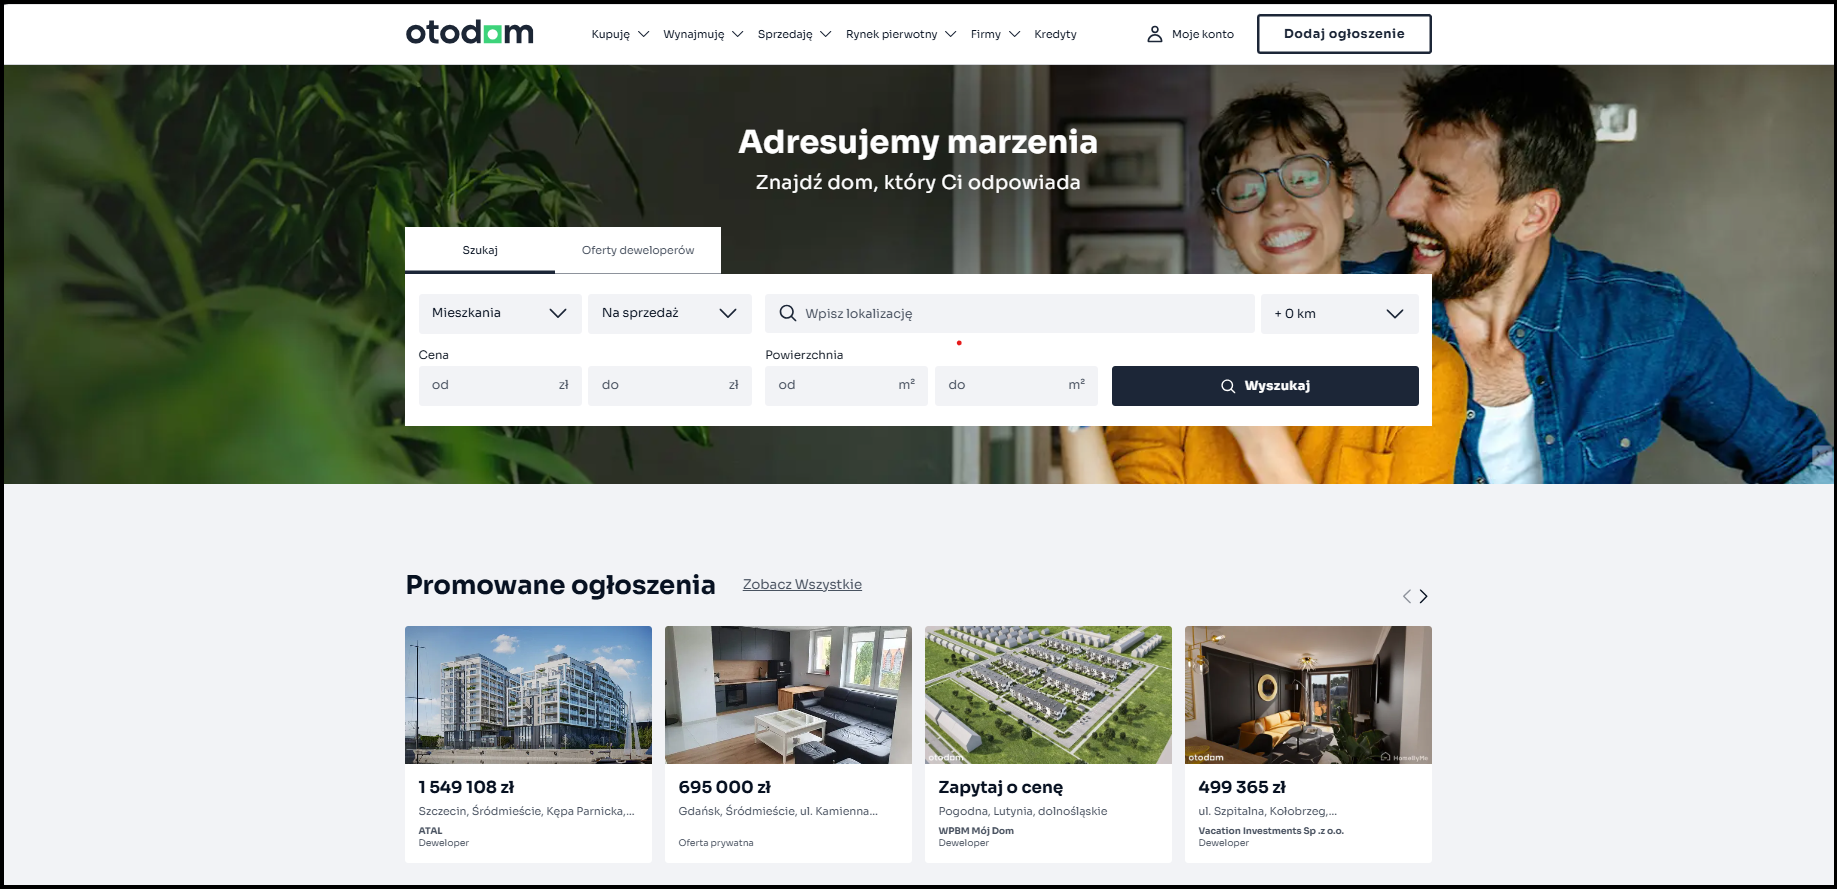
Scraped 10,000 records from Otodom, Poland’s leading real estate platform. Cleaned and processed data using Python pipelines to ensure high-quality insights.
Uploaded datasets to Snowflake for further exploratory analysis and reporting.
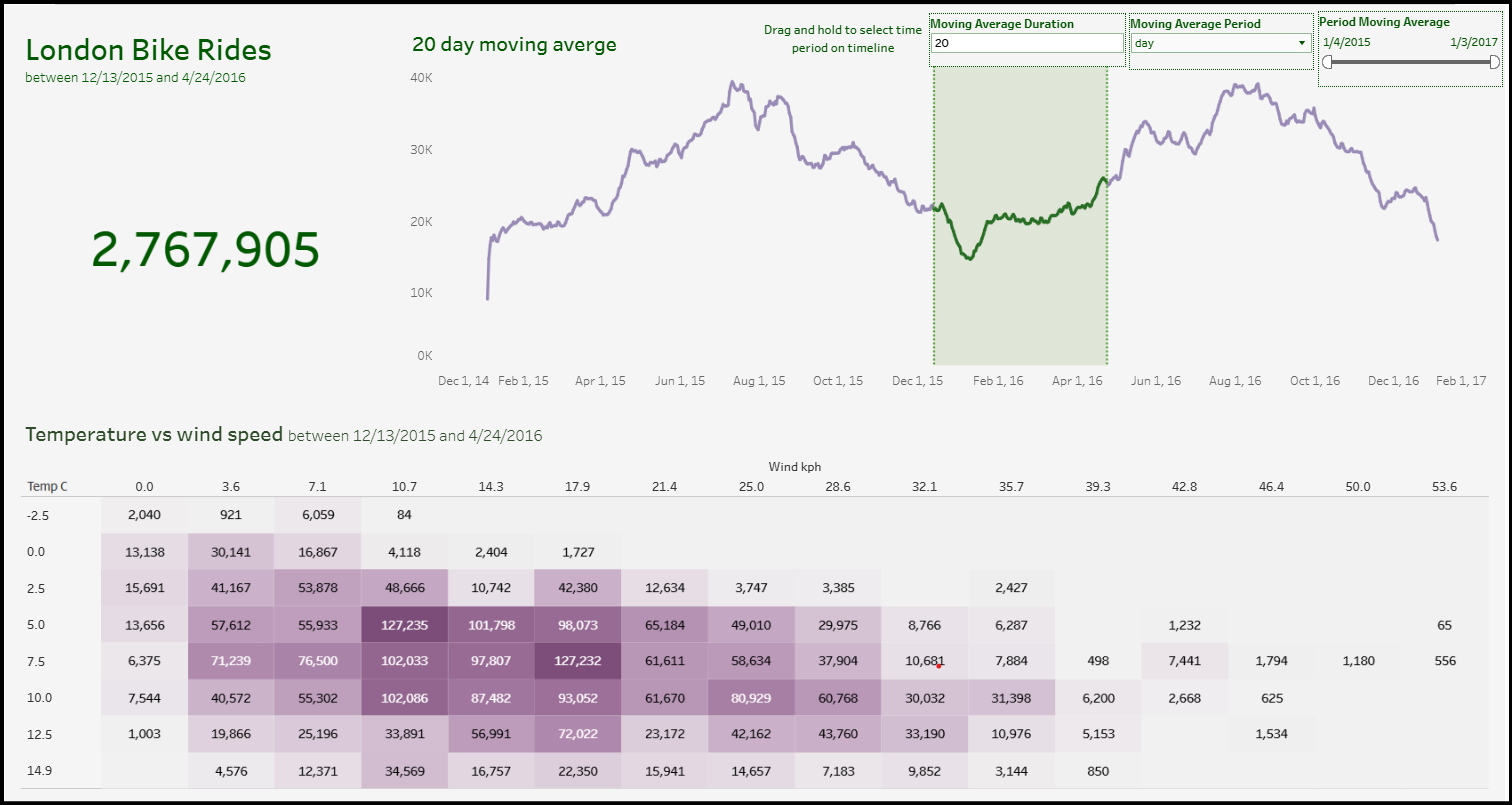
Processed and cleaned 2015-2017 London bike rides data, transforming unclear numeric data into meaningful insights.
Visualized results using Tableau, uncovering trends and correlations related to seasonality and weather patterns.

Analyzed Movies dataset including gross revenue and budget for more than 7,600 movies between 1989 - 2020, and discovering the possible correlations.

Cleaned Nashville Housing Data using SQL. Filled missing values in Property Address field with proper values using a reference field (ParcelID).
Split Property Address and Owner Address fields into street, city and state. Limited the possible values for soldasvacant field to Yee, No.
Then finished by removing duplicates and unnecessary fields.
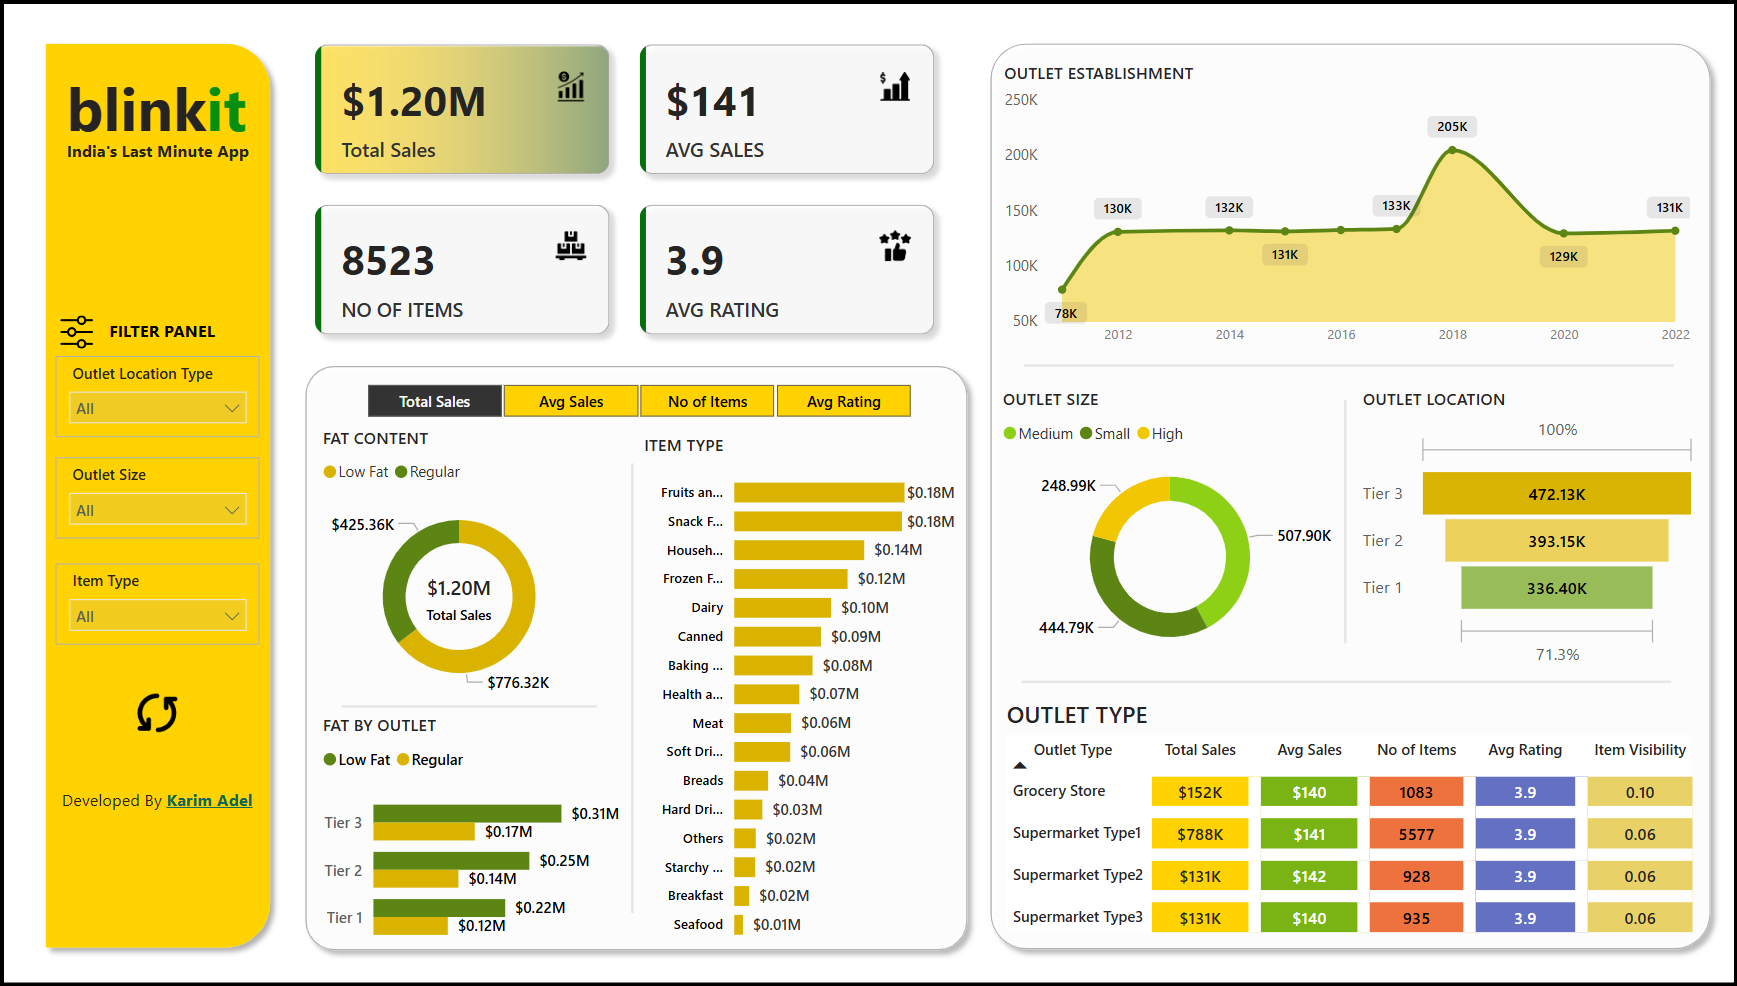
Blinkit grocery power bi dashboard for sales between 2011 - 2022. I built a beautiful interactive dashboard highlighting many KPIs including Total Revenue, Number of Items
and Average Ratings. Also, I visualized data divided by location, item type, outlet size. Check it out.
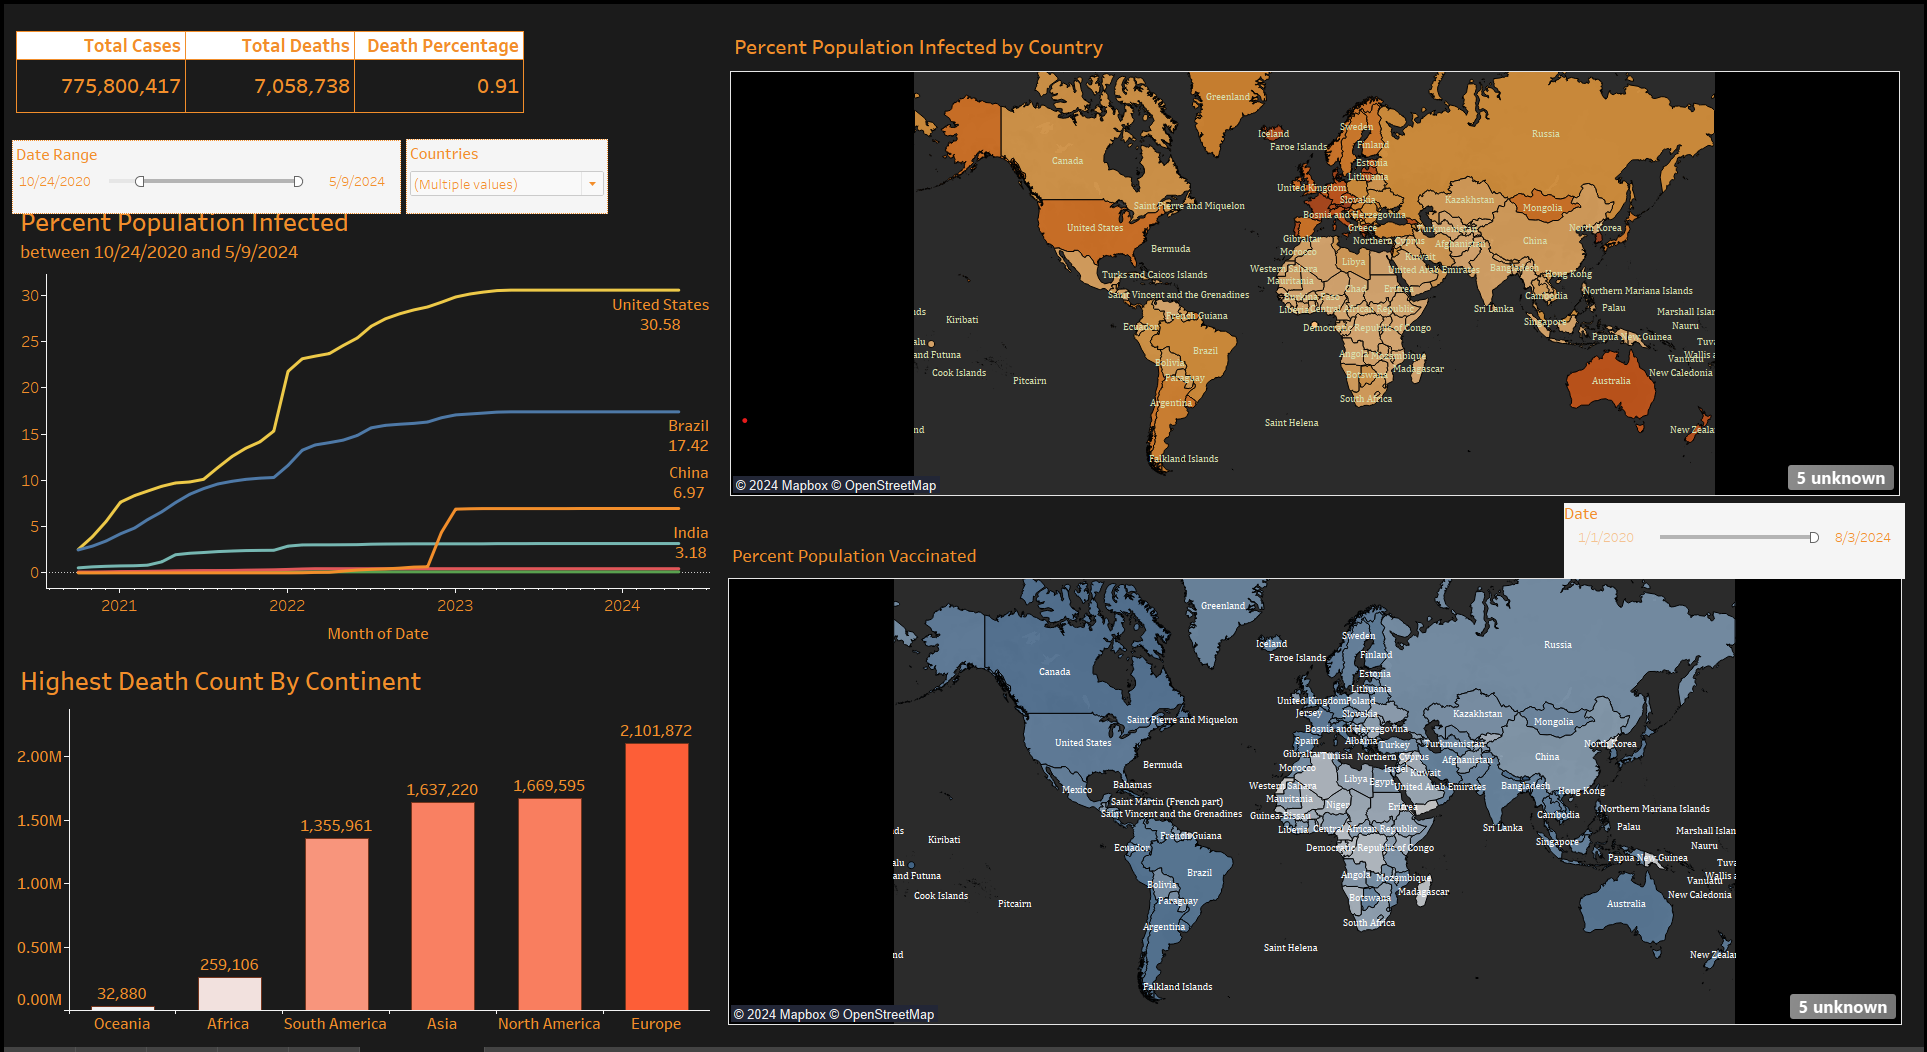
Analyzed the global impact of the Covid-19 pandemic from 2020 to 2024. Leveraged Python, SQL, and Tableau to track total case and death counts across countries and continents,
visualizing key insights through an interactive dashboard.
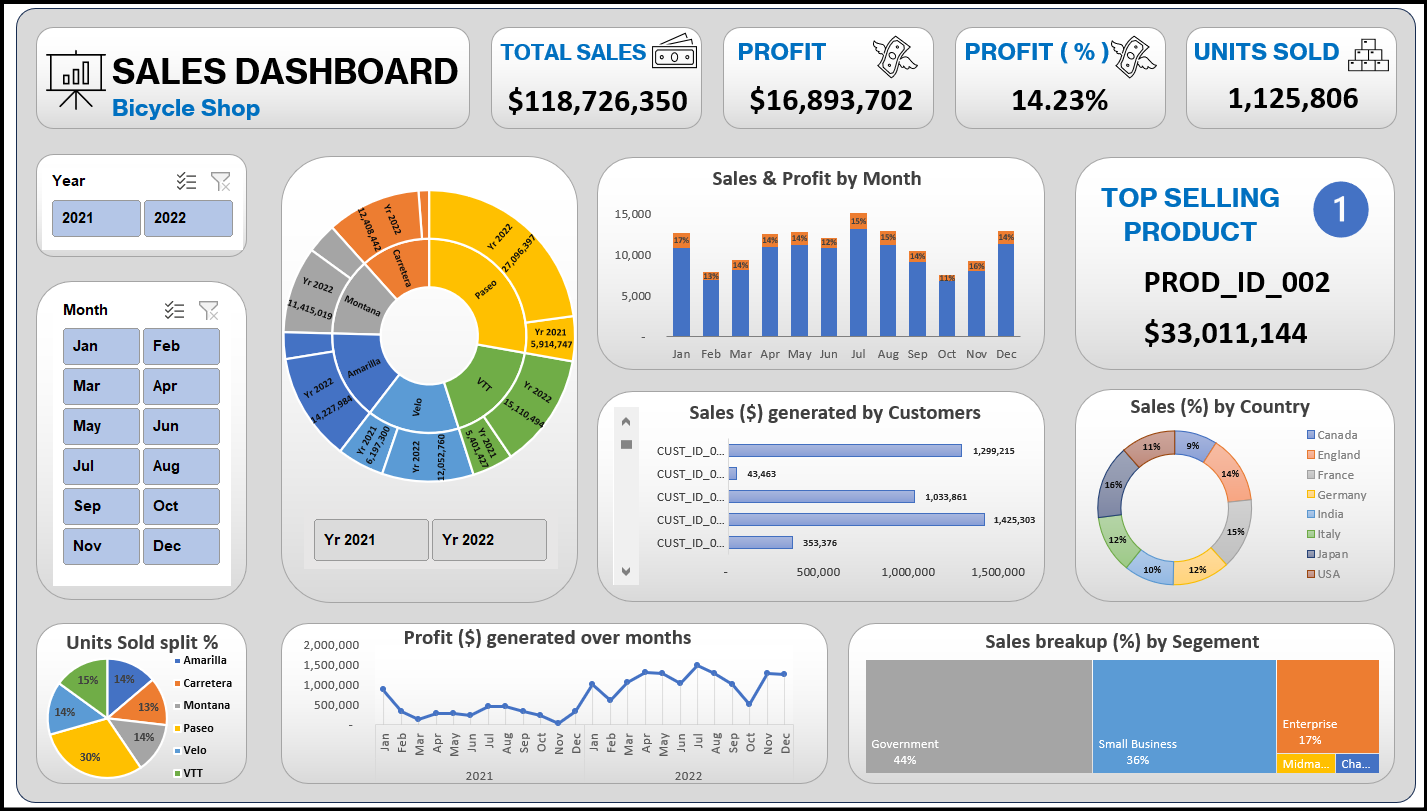
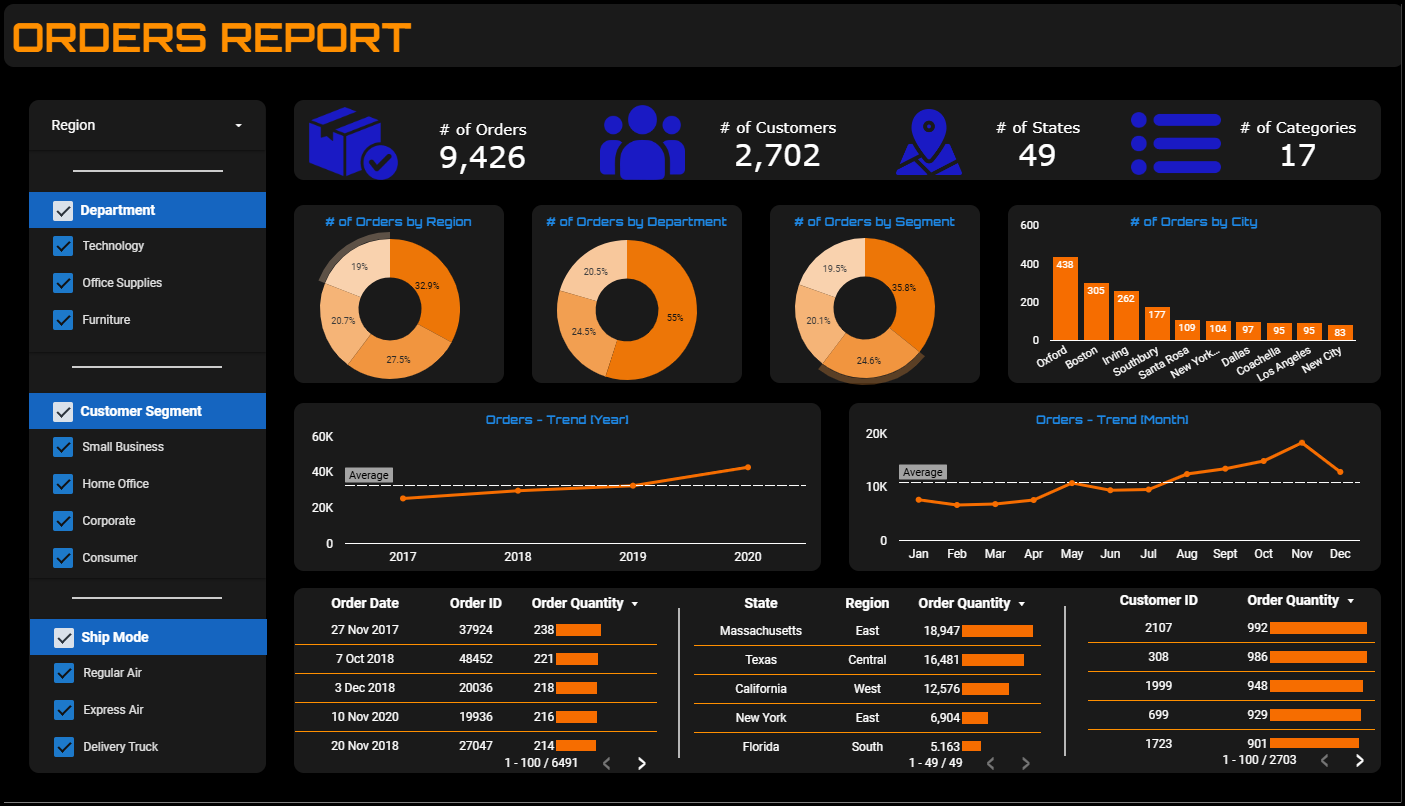
Built an interactive Excel dashboard to track KPIs and visualize revenue and profit breakdowns across various sales segments and locations. Enabled insights
into performance over different timeframes for better decision-making.
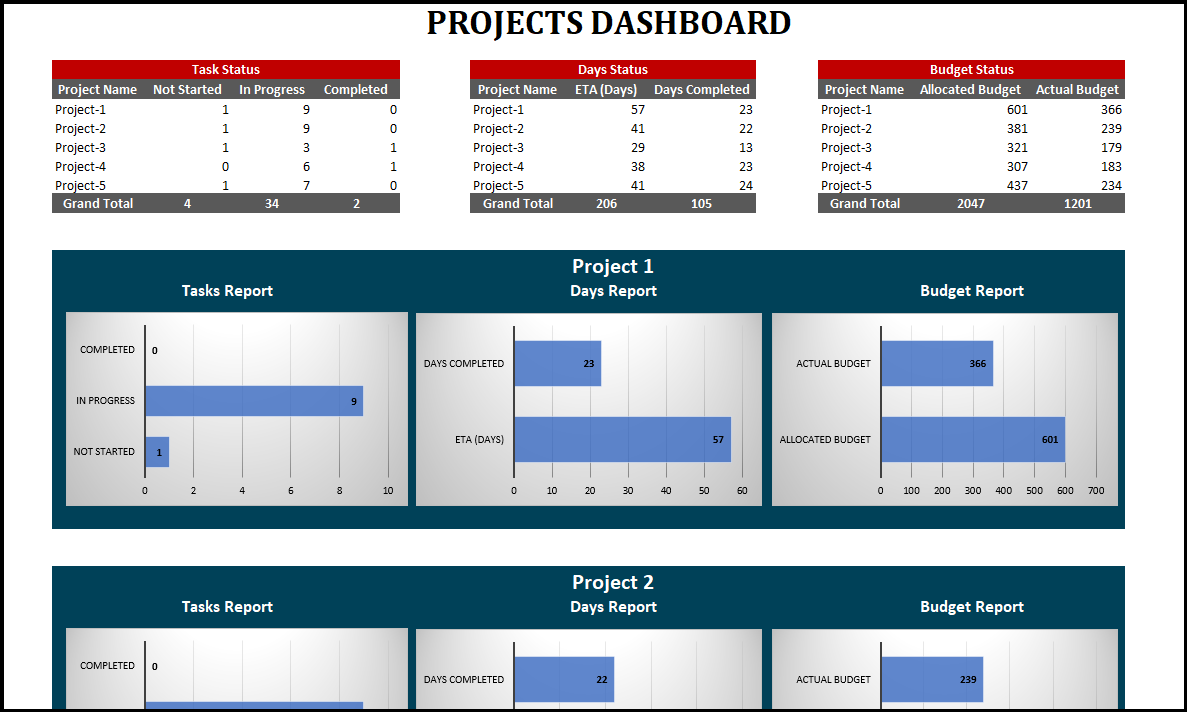
Built an interactive Excel Task Tracker to track the completed and left work for each agent and for each project for better decision-making.
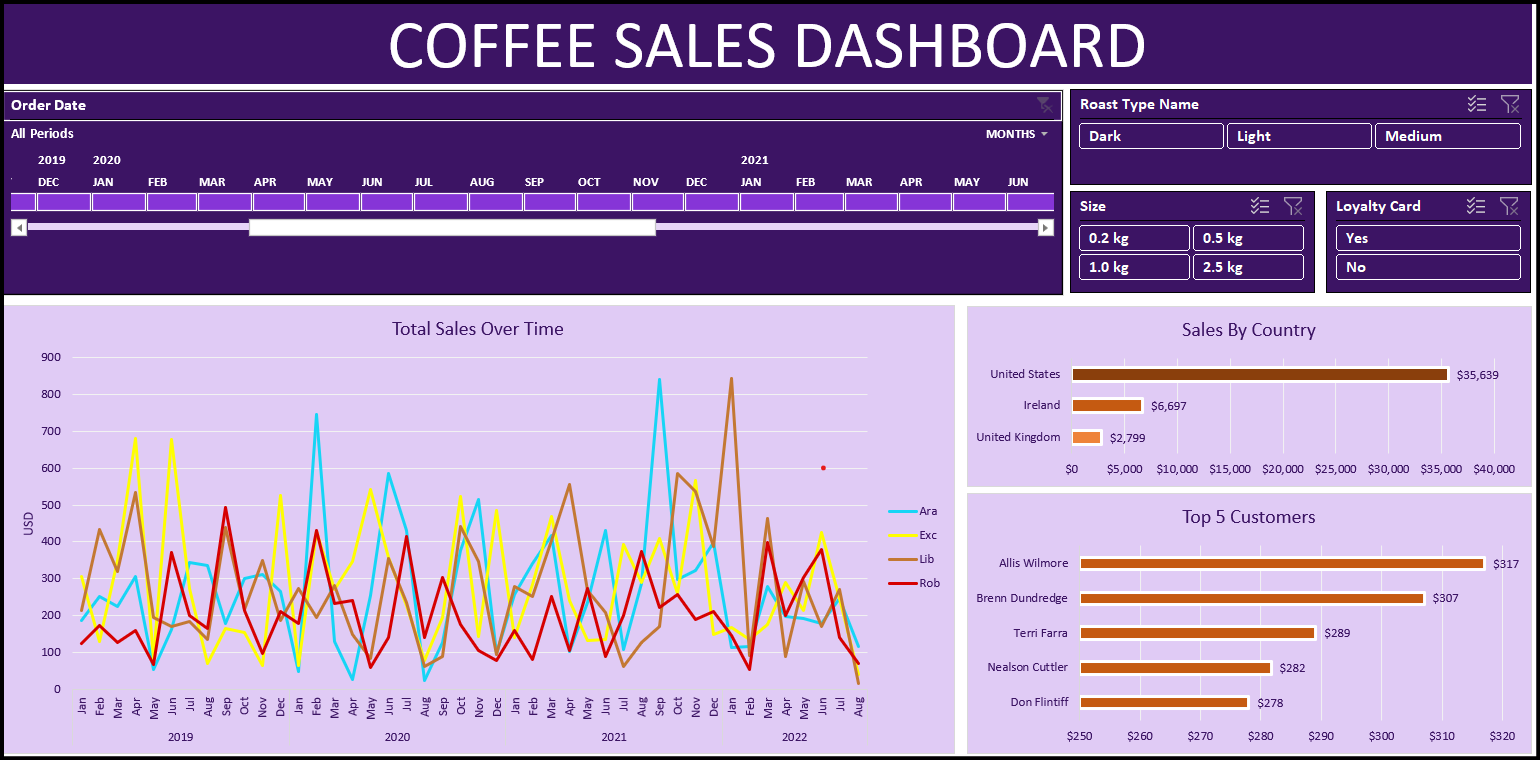
Built interactive Excel dashboard for coffee sales between 2019 - 2022 of a company. Collected the data from different sheets using excel lookup functions.
Created pivot tables required to create the charts. Created the charts and formatted them then put them together in a dashboard.
Built interactive Looker dashboard for Store sales between 2017 - 2020. Retrieved the data from google sheets,
designed the charts and formatted them, then organized them together in a beautiful dashboard.
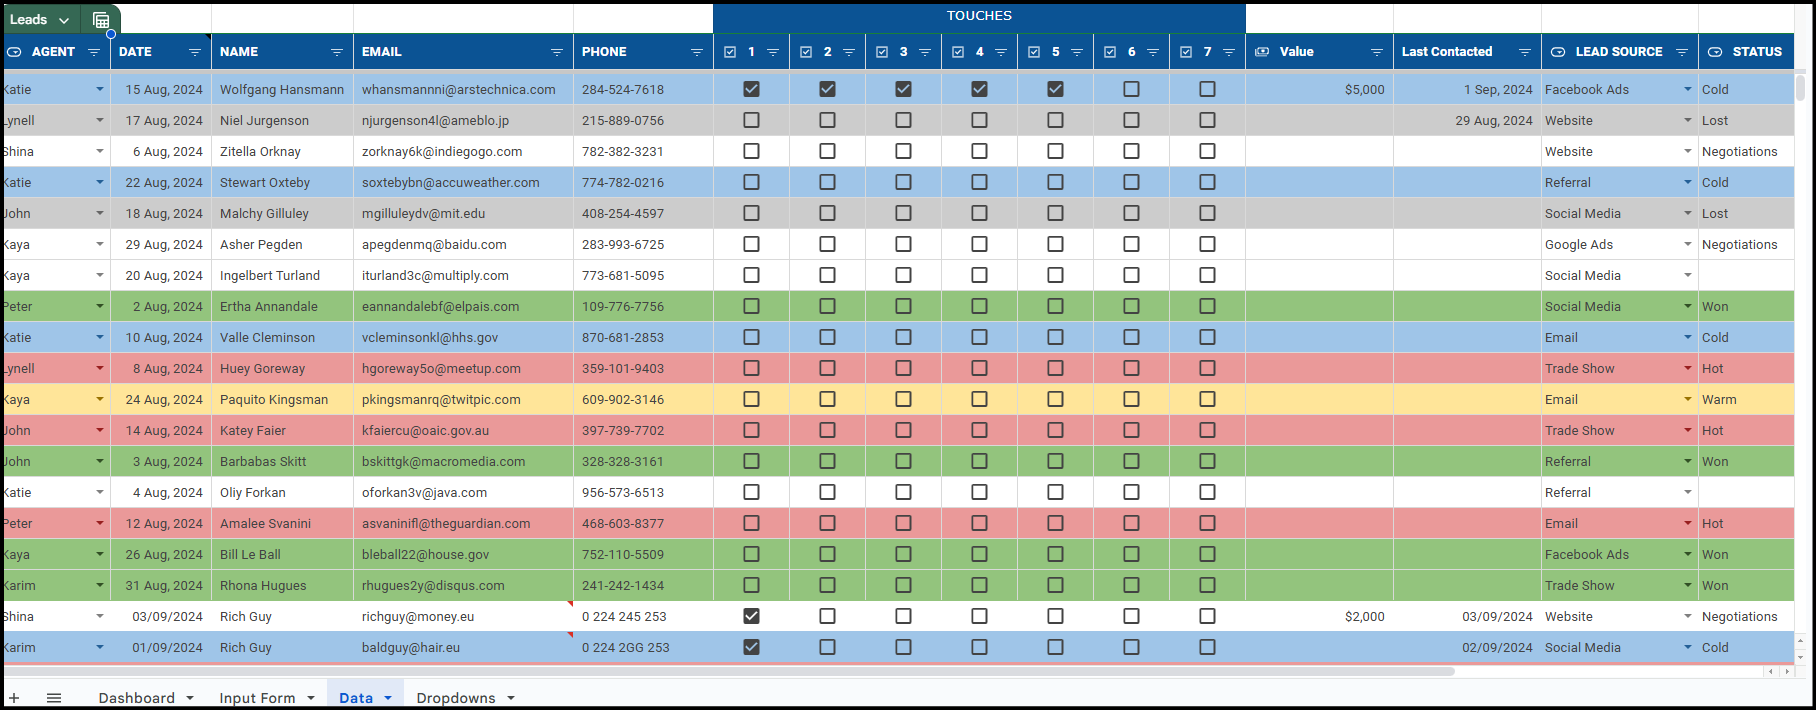
Built Lead CRM template with google sheets for small-scale companies. The template contains drop-downs and tick boxes for easier interaction.
The template also contains Input form sheet to enter new records easily and avoid messing up the database or violating data validation rules. With simple dashboard for quick overview.